
RSI Indicator คืออะไร? วิธีใช้ Overbought Oversold Divergence Forex
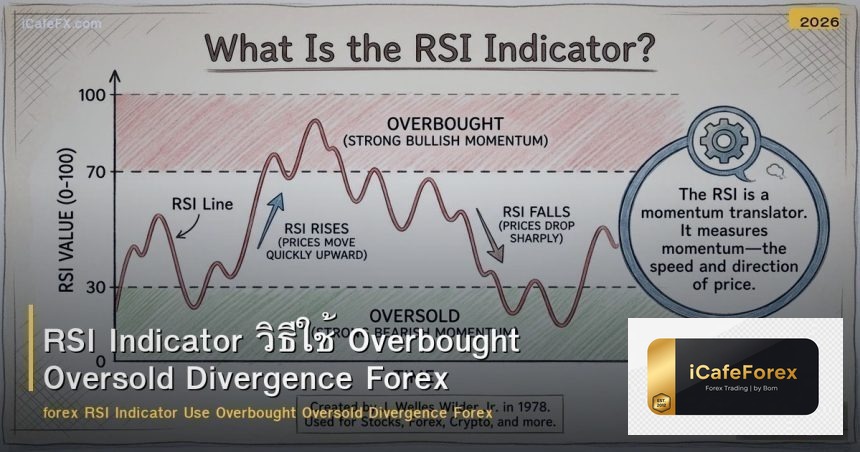
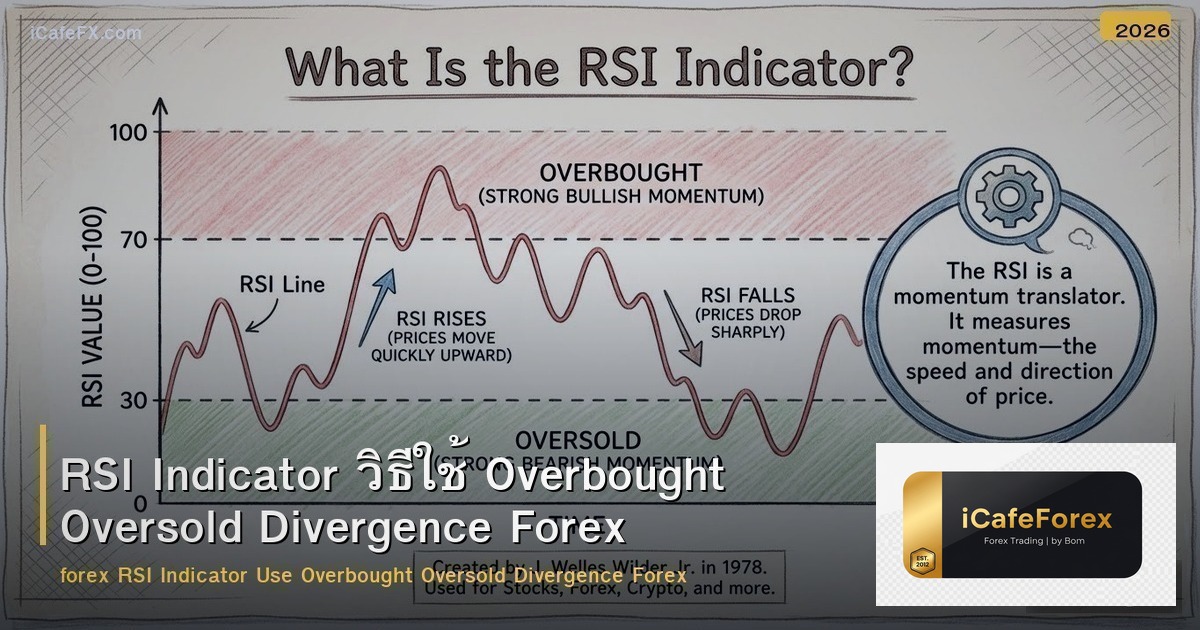
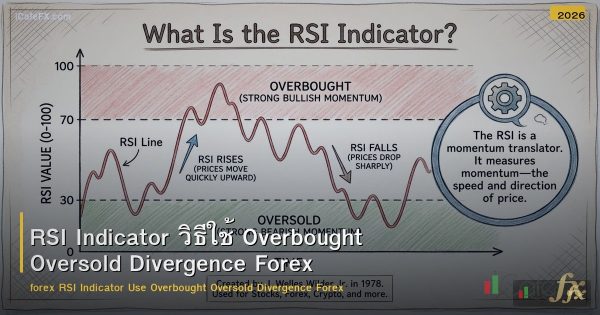
RSI (Relative Strength Index) คือMomentum Oscillator ที่วัดความเร็วและขนาดของการเปลี่ยนแปลงราคา ค่า 0-100 RSI เหนือ 70 = Overbought (ซื้อมากเกิน) RSI ใต้ 30 = Oversold (ขายมากเกิน) RSI เป็น Indicator ที่ใช้มากที่สุดใน Forex พัฒนาโดย J. Welles Wilder Setting Default: Period 14 RSI ใช้ 3 แบบ: OB/OS Level (70/30) Centerline Cross (50) และ Divergence RSI Divergence เป็น Signal ที่แข็งที่สุด: ราคา HH แต่ RSI LH = Bearish Divergence RSI ทำงานดีทั้ง Trending และ Range Market แต่ค้าง OB/OS นานใน Strong Trend RSI Indicator Use Overbought Oversold Divergence Forex RSI พื้นฐาน: สูตร: RSI = 100 – (100 / (1 + RS)) RS = Average Gain / Average Loss (14 Period) RSI > 70: Overbought → ราคาอาจลง ⚠️ RSI
RSI Signal
| Signal | ลักษณะ | ใช้ |
|---|---|---|
| OB Sell | RSI > 70 + กลับลง | Sell Signal (Range) ✅ |
| OS Buy | RSI | Buy Signal (Range) ✅ |
| Centerline ↑ | RSI ข้าม 50 ขึ้น | Bullish Momentum ✅ |
| Bullish Divergence | ราคา LL + RSI HL | Reversal Buy ✅✅ |
| Bearish Divergence | ราคา HH + RSI LH | Reversal Sell ✅✅ |
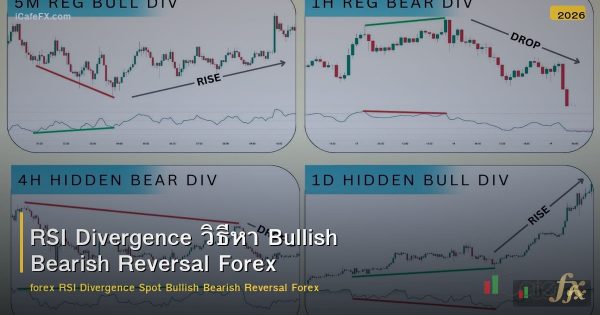
RSI Divergence
- Bullish Divergence: ราคา Lower Low แต่ RSI Higher Low → Momentum อ่อน → อาจกลับขึ้น ✅✅
- Bearish Divergence: ราคา Higher High แต่ RSI Lower High → Momentum อ่อน → อาจกลับลง ✅✅
- Hidden Bullish: ราคา HL + RSI LL → Continuation Buy
- Hidden Bearish: ราคา LH + RSI HH → Continuation Sell
RSI + Trend
- Uptrend: RSI มักอยู่ 40-80 → Oversold ที่ 40 ไม่ใช่ 30
- Downtrend: RSI มักอยู่ 20-60 → Overbought ที่ 60 ไม่ใช่ 70
- ปรับ Level: Uptrend ใช้ 40/80 / Downtrend ใช้ 20/60 → แม่นยำกว่า 30/70
กลยุทธ์ RSI
กลยุทธ์: RSI OS + Key Level + Trend
- D1 Uptrend: Buy Only
- Key Support: ราคา Pullback ถึง Key Support
- RSI Oversold Zone (Uptrend Adjusted)
- RSI กลับขึ้น: RSI เริ่มกลับขึ้นจาก OS → Momentum กลับ
- Candle: Bullish Candle → Buy
- SL: ใต้ Key Support + Buffer
- TP: Key Resistance R:R 1:2
RSI vs Stochastic
- RSI: ช้ากว่า → Signal น้อยกว่า → น่าเชื่อถือกว่า ✅
- Stochastic: ไวกว่า → Signal บ่อยกว่า → False Signal มากกว่า
- ทั้งคู่: RSI OB + Stochastic OB = Double Confirm ✅✅
ข้อจำกัด
- Strong Trend: RSI ค้าง OB/OS นาน → ใช้ 30/70 ไม่แม่น → ปรับ Level ตาม Trend
- ไม่ใช้เดี่ยว: RSI + Trend + Key Level + Candle → ไม่ใช้เดี่ยว
- Lagging: RSI คำนวณจากอดีต → ช้ากว่า PA
สรุป RSI Indicator สำหรับ Forex
RSI 14 Period 70 OB 30 OS 50 Centerline Divergence Bullish Bearish Hidden OB/OS Signal Trend Adjusted 40/80 20/60 Key Level Candle Stochastic เปรียบเทียบ Double Confirm Strong Trend ค้าง ไม่ใช้เดี่ยว Lagging ติดตามสัญญาณเทรดได้ที่ xmsignal.com และอ่านบทความเพิ่มเติมที่ siamlancard.com และ siam2r.com


 TH ▼
TH ▼
 English
 Tiếng Việt
 Indonesia
 Melayu
 ខ្មែរ
ខ្មែរ ລາວ
ລາວ 日本語
日本語 한국어
한국어 简体中文
简体中文