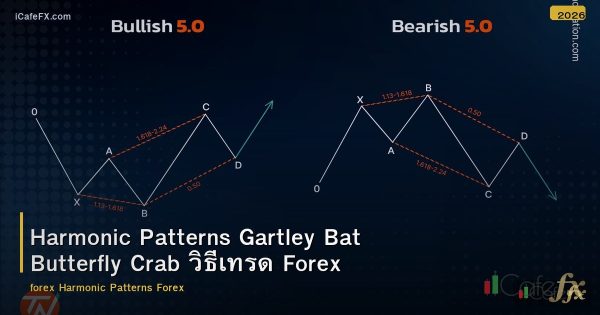
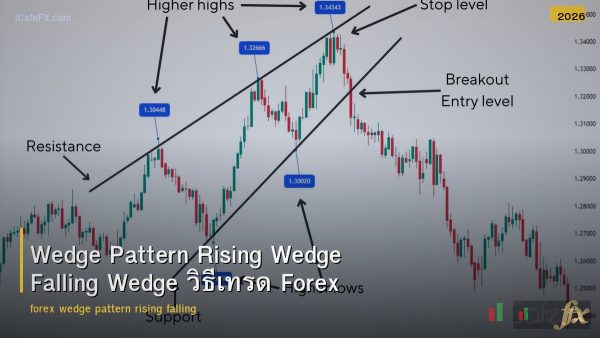
RSI Indicator คืออะไร? วิธีใช้ Overbought Oversold Divergence Forex
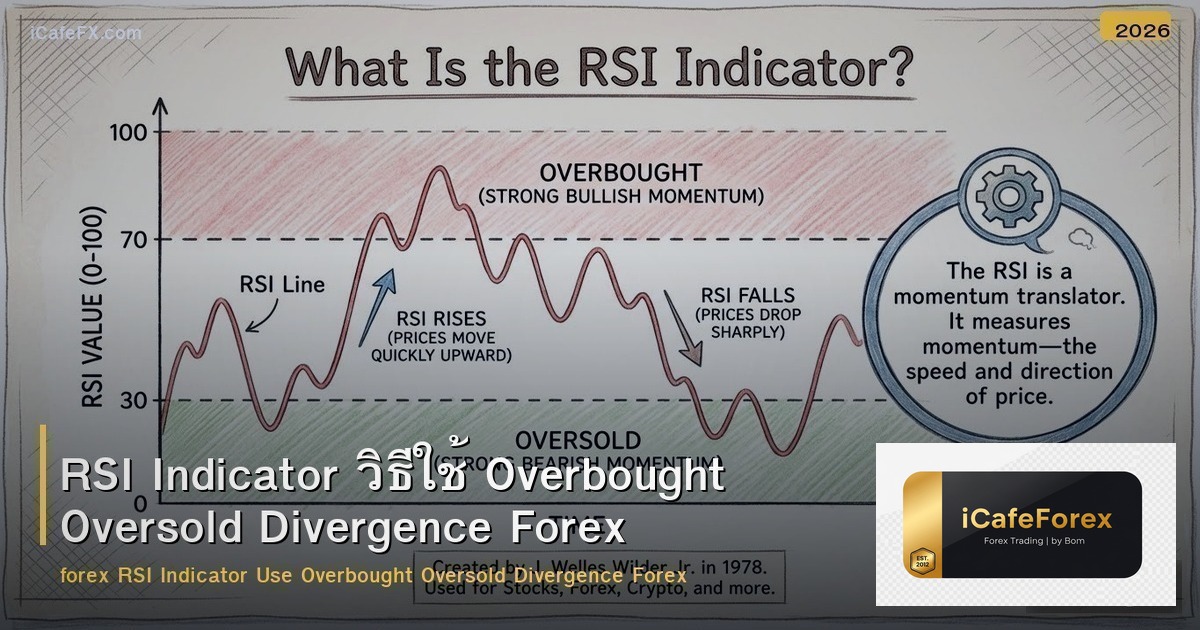
RSI (Relative Strength Index) คือOscillator Indicator ที่นิยมที่สุดในโลก พัฒนาโดย J. Welles Wilder ปี 1978 RSI วัด Momentum ของราคาในช่วง 0-100 RSI > 70 = Overbought (ซื้อมากเกิน อาจลง) RSI RSI Indicator Use Overbought Oversold Divergence Forex RSI ใช้ 3 แบบ: 1) OB/OS: RSI > 70 = Overbought อาจลง / RSI 50 = Bullish Momentum / RSI
RSI Signal
| RSI Level |
สถานะ |
ใช้ |
| > 70 |
Overbought |
อาจลง → Sell Signal (ใน Range) ⚠️ |
| 50-70 |
Bullish Momentum |
Trend ขึ้น → Buy Bias ✅ |
| 50 |
Neutral / Midline |
เหนือ 50 = Bullish / ใต้ 50 = Bearish |
| 30-50 |
Bearish Momentum |
Trend ลง → Sell Bias ✅ |
|
Oversold |
อาจขึ้น → Buy Signal (ใน Range) ⚠️ |
RSI Overbought/Oversold
- RSI ราคาลงเร็วเกิน → มีโอกาสกลับขึ้น → Buy Signal ใน Range
- RSI > 70 (Overbought): ราคาขึ้นเร็วเกิน → มีโอกาสกลับลง → Sell Signal ใน Range
- ข้อควรระวัง: Strong Trend → RSI อยู่ OB/OS ได้นาน → ไม่ใช้ OB/OS สวน Strong Trend
- ใช้ใน Range: RSI OB/OS ทำงานดีใน Range Market → ไม่ดีใน Trending Market
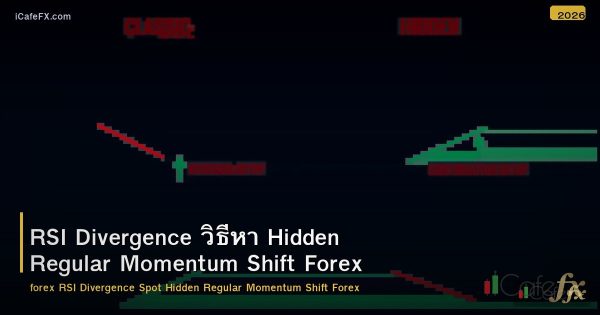
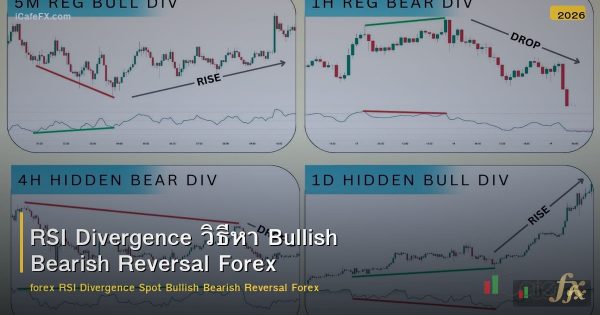
RSI Divergence (ทรงพลังสุด)
- Bullish Divergence: ราคาทำ Lower Low + RSI ทำ Higher Low → Momentum ขาลงอ่อน → อาจกลับขึ้น ✅✅
- Bearish Divergence: ราคาทำ Higher High + RSI ทำ Lower High → Momentum ขาขึ้นอ่อน → อาจกลับลง ✅✅
- Divergence + Key Level: Divergence ที่ Key Level = Strong Reversal Signal ✅✅✅
- D1/H4 Divergence: น่าเชื่อถือมาก → M5 Divergence = Noise
RSI 50 Level (Trend Filter)
- RSI > 50: Bullish Momentum → Buy Bias → เทรดฝั่ง Buy เป็นหลัก
- RSI Bearish Momentum → Sell Bias → เทรดฝั่ง Sell เป็นหลัก
- RSI Cross 50: RSI ข้าม 50 จากล่างขึ้นบน = Momentum เปลี่ยน Bullish
กลยุทธ์ RSI
กลยุทธ์: RSI Divergence + Key Level + Candle
- D1 Key Support: ราคาลงถึง D1 Key Support
- RSI Divergence: ราคา LL + RSI HL → Bullish Divergence ✅
- Candle: Bullish Pin Bar / Engulfing ที่ Key Support → Buy
- SL: ใต้ Key Support + Buffer
- TP: Key Resistance R:R 1:2
RSI ข้อผิดพลาด
- สวน Trend: RSI OB ใน Strong Uptrend → Sell → แพ้ → ไม่ Sell OB ใน Uptrend
- ใช้เดี่ยว: RSI อย่างเดียวไม่พอ → RSI + Key Level + Candle + Trend
- TF เล็ก: M1 M5 RSI = Noise → D1 H4 RSI น่าเชื่อถือ
ข้อจำกัด
- Lagging: RSI คำนวณจากราคาอดีต → Lagging → ช้ากว่า PA
- Strong Trend: RSI OB/OS นานได้ → ไม่สวน Trend
- ไม่ใช้เดี่ยว: RSI + Key Level + Candle + Trend → ไม่ใช้เดี่ยว
สรุป RSI Indicator สำหรับ Forex
RSI Relative Strength Index 0-100 OB > 70 OS xmsignal.com และอ่านบทความเพิ่มเติมที่ siamlancard.com และ siam2r.com
🚀
เริ่มต้นเทรดกับเรา
เปิดบัญชีเทรดฟรี รับโบนัส $30 ไม่ต้องฝากเงิน!
👉 สมัครเลย


 TH ▼
TH ▼
 English
 Tiếng Việt
 Indonesia
 Melayu
 ខ្មែរ
ខ្មែរ ລາວ
ລາວ 日本語
日本語 한국어
한국어 简体中文
简体中文