

RSI Relative Strength Index คืออะไร? วิธีใช้ Overbought Oversold Forex
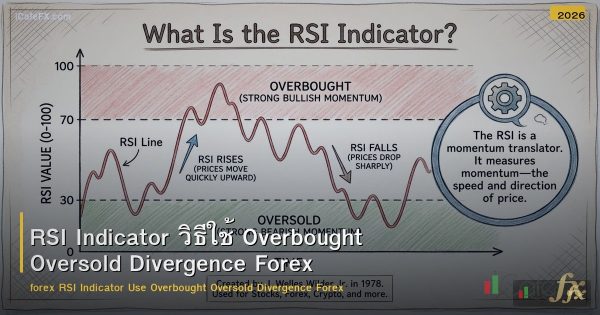
RSI (Relative Strength Index) คือOscillator Indicator ที่วัดความแรงของราคาในช่วง 0-100 โดยใช้ Average Gain vs Average Loss ในช่วง 14 Period (Default) RSI เป็น Indicator พื้นฐานที่ใช้มากที่สุดรองจาก MA ✅ RSI Levels: > 70 = Overbought: ราคาแพงเกิน → อาจ Pullback → Sell Signal ในRange ✅ RSI Relative Strength Index Use Overbought Oversold Forex RSI Levels: > 70: Overbought → อาจ Pullback ✅
RSI Relative Strength Index Overbought Oversold 70 30 50 Divergence Bullish Bearish Trend Filter Centerline Momentum Lagging False Divergence ติดตามสัญญาณเทรดได้ที่ xmsignal.com และอ่านบทความเพิ่มเติมที่ siamlancard.com และ siam2r.comRSI Signals
Signal
ลักษณะ
ใช้
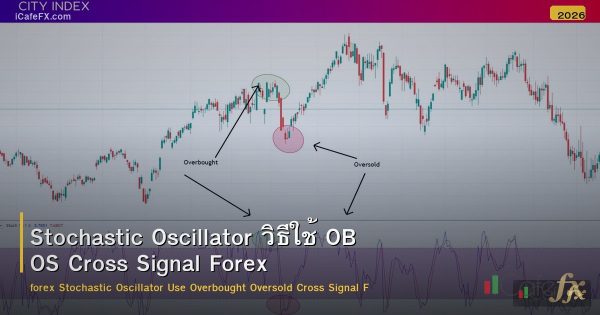
Overbought (>70)
ราคาแพง
Range: Sell / Trend: ระวัง ✅
Oversold (
ราคาถูก
Range: Buy / Trend: ระวัง ✅
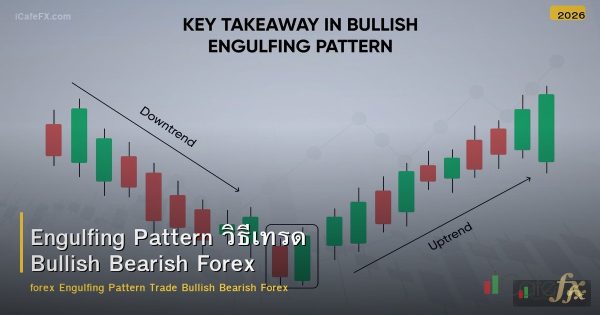
Bullish Divergence
ราคา LL RSI HL
Reversal ขึ้น ✅✅✅
Bearish Divergence
ราคา HH RSI LH
Reversal ลง ✅✅✅
Centerline Cross
RSI ข้าม 50
Momentum เปลี่ยน ✅
วิธีใช้ RSI
กลยุทธ์ RSI
กลยุทธ์: RSI Divergence + OB + PA Confirm
ข้อจำกัด
สรุป RSI Relative Strength Index สำหรับ Forex


 TH ▼
TH ▼
 English
 Tiếng Việt
 Indonesia
 Melayu
 ខ្មែរ
ខ្មែរ ລາວ
ລາວ 日本語
日本語 한국어
한국어 简体中文
简体中文