

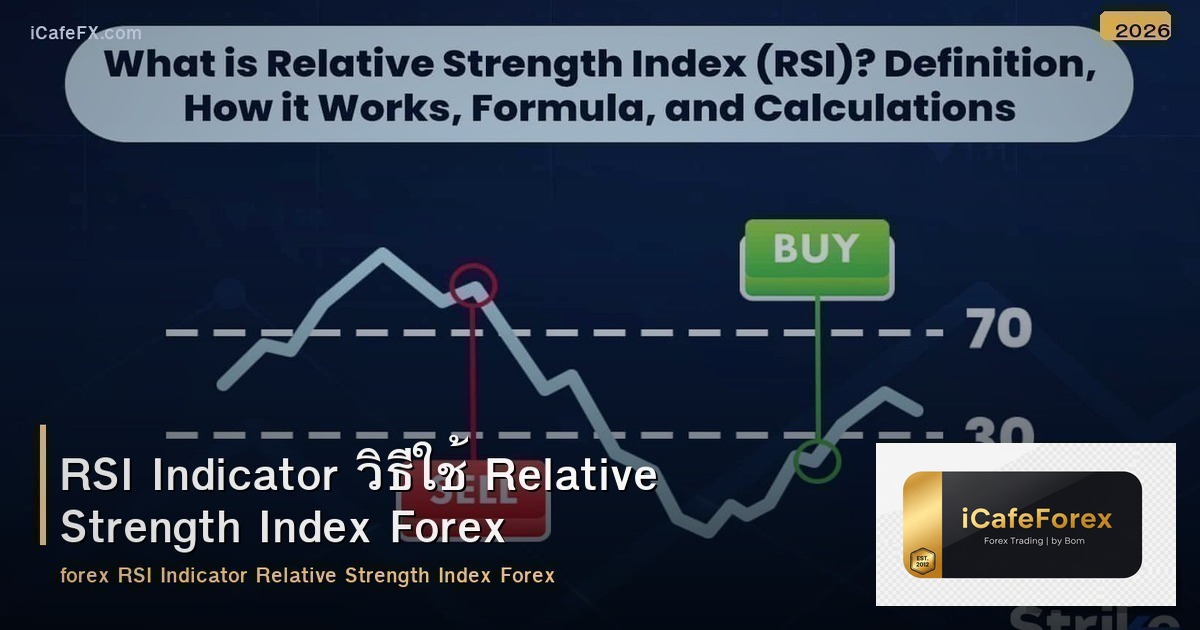
RSI Indicator คืออะไร? วิธีใช้ Relative Strength Index Forex
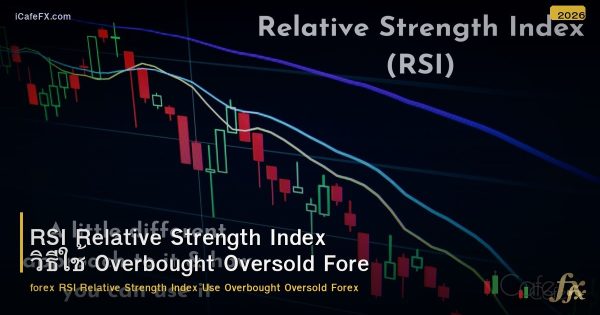
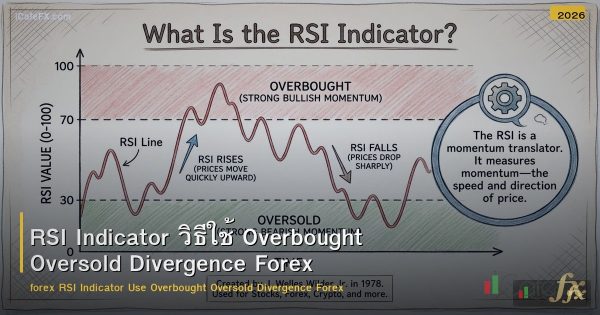
RSI (Relative Strength Index) คือIndicator ที่วัดความแข็งแรงของ Momentum โดยเปรียบเทียบขนาดของ Gain กับ Loss ในช่วง N Period ค่าอยู่ระหว่าง 0-100 โดย > 70 = Overbought และ RSI Indicator Relative Strength Index Forex พัฒนาโดย J. Welles Wilder (1978) RSI ใช้ง่าย อ่านง่าย และให้สัญญาณหลายแบบ: OB/OS Divergence Failure Swing และ Trend Filter เป็น Indicator ที่เทรดเดอร์ทุกระดับควรเรียนรู้
Menu
📋 สารบัญ
โครงสร้าง RSI
- RSI (14): Default Setting → วัดจาก 14 Period ล่าสุด
- 70 Level: Overbought → Momentum ซื้อแรงเกิน → อาจชะลอ/กลับตัว
- 30 Level: Oversold → Momentum ขายแรงเกิน → อาจชะลอ/กลับตัว
- 50 Level: Midline → เหนือ 50 = Bullish Bias / ใต้ 50 = Bearish Bias
- ค่า: 0-100 → ไม่มี Upper/Lower Limit
วิธีอ่าน RSI
- RSI > 70: Overbought → Buying Momentum แรงมาก → อาจชะลอ (ไม่ใช่ต้อง Sell เสมอ)
- RSI Oversold → Selling Momentum แรงมาก → อาจชะลอ (ไม่ใช่ต้อง Buy เสมอ)
- RSI 50-70: Bullish Momentum → Buy Bias
- RSI 30-50: Bearish Momentum → Sell Bias
- RSI ขึ้น: Buying Momentum เพิ่ม
- RSI ลง: Buying Momentum ลด (หรือ Selling เพิ่ม)
สัญญาณ RSI
1. Overbought/Oversold
- RSI > 70 + Key Resistance: Overbought ที่ Resistance → อาจลง → Sell Signal
- RSI Oversold ที่ Support → อาจขึ้น → Buy Signal
- สำคัญ: OB/OS เดี่ยว ≠ ต้อง Reverse → ต้องมี Key Level + Candle Confirm
- Trend แข็ง: RSI > 70 นาน = ปกติใน Strong Uptrend → ไม่ Sell สวน
2. RSI Divergence
- Bullish Divergence: ราคา Lower Low + RSI Higher Low → Selling Momentum ลด → อาจขึ้น
- Bearish Divergence: ราคา Higher High + RSI Lower High → Buying Momentum ลด → อาจลง
- ดีที่สุด: Divergence ที่ Key Level = A+ Setup
- ระวัง: Divergence ≠ Reverse ทันที → อาจมี Divergence 2-3 ครั้งก่อน Reverse จริง
3. RSI Failure Swing
- Bullish Failure Swing: RSI ลงใต้ 30 → ขึ้นเหนือ 30 → ลงมาไม่ถึง 30 → ขึ้นผ่าน High ก่อนหน้า → Buy
- Bearish Failure Swing: RSI ขึ้นเหนือ 70 → ลงใต้ 70 → ขึ้นไม่ถึง 70 → ลงผ่าน Low ก่อนหน้า → Sell
- ข้อดี: สัญญาณน่าเชื่อถือสูง (Wilder แนะนำ)
4. RSI 50 Level
- RSI Cross เหนือ 50: Bullish Bias → Buy เท่านั้น
- RSI Cross ใต้ 50: Bearish Bias → Sell เท่านั้น
- ใช้: เป็น Trend Filter ง่ายๆ
กลยุทธ์ RSI
กลยุทธ์ที่ 1: RSI + Key Level + Candle (แนะนำ)
- Setup: D1 Key Support + RSI
- Buy: Triple Confirm (Key Level + RSI OS + Candle) → Buy
- SL: ใต้ Key Support / TP Key Resistance R:R 1:2
กลยุทธ์ที่ 2: RSI Divergence + Key Level
- Setup: D1 Key Resistance + Bearish RSI Divergence + Bearish Candle
- Sell: Divergence + Key Level + Candle → Sell
กลยุทธ์ที่ 3: RSI Trend Filter
- กฎ: RSI > 50 = Buy Only / RSI
- ใช้: กรอง Direction ร่วมกับ EMA 200 + Key Level
RSI Setting
| Setting | Period | เหมาะ |
|---|---|---|
| Fast | 7-9 | Scalping Short-term (สัญญาณบ่อย False มาก) |
| Default | 14 | ทั่วไป (แนะนำ ไม่ต้องเปลี่ยน) |
| Slow | 21-25 | Swing Position (สัญญาณน้อย น่าเชื่อถือ) |
RSI ใน Trend vs Range
| ตลาด | RSI OB/OS | วิธีใช้ |
|---|---|---|
| Range | OB > 70 อาจลง / OS | Bounce ที่ OB/OS + Key Level |
| Uptrend | RSI 40-80 (ไม่ลงถึง 30) | RSI 40-50 = Buy Pullback Zone |
| Downtrend | RSI 20-60 (ไม่ขึ้นถึง 70) | RSI 50-60 = Sell Rally Zone |
สำคัญ: ใน Strong Uptrend RSI Range จะเลื่อนขึ้น (40-80) ใน Strong Downtrend RSI Range จะเลื่อนลง (20-60) → ปรับ OB/OS ตาม Trend
ข้อจำกัด
- OB ≠ ต้อง Sell: RSI > 70 ใน Uptrend = ปกติ → ไม่ Sell สวน Trend
- Lagging: RSI ตามราคา → สัญญาณช้ากว่า Price Action
- Divergence ช้า: Divergence อาจเกิด 2-3 ครั้งก่อน Reverse จริง
- ไม่ใช้เดี่ยว: RSI + Key Level + Candle + Trend = ดี / RSI เดี่ยว Win Rate ~55%
สรุป RSI Indicator สำหรับ Forex
RSI วัด Momentum 0-100 OB > 70 OS xmsignal.com และอ่านบทความเพิ่มเติมที่ siamlancard.com และ siam2r.com


 TH ▼
TH ▼
 English
 Tiếng Việt
 Indonesia
 Melayu
 ខ្មែរ
ខ្មែរ ລາວ
ລາວ 日本語
日本語 한국어
한국어 简体中文
简体中文