
Order Flow คืออะไร? วิธีอ่าน Volume Footprint Chart Forex
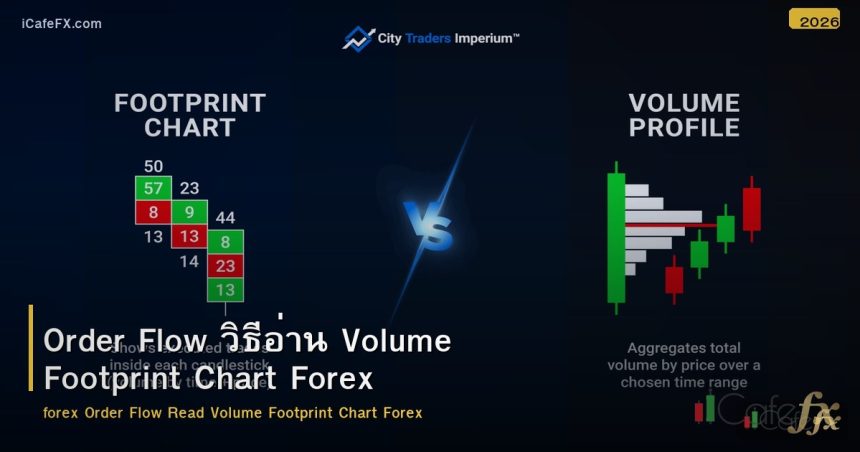
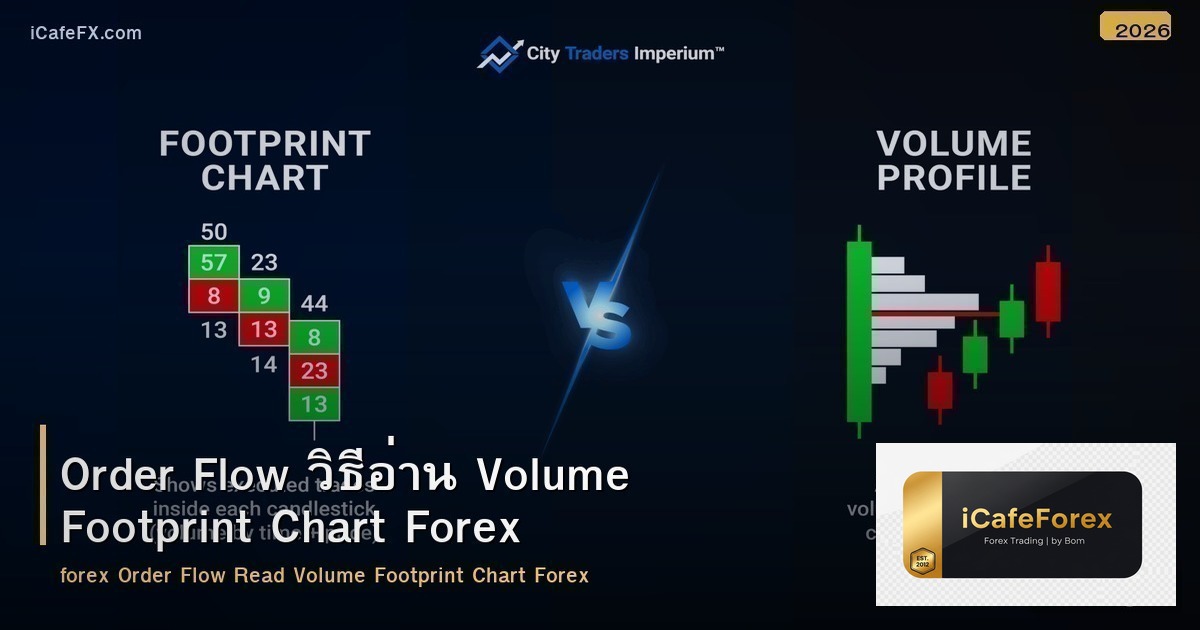
Order Flow คือการวิเคราะห์ราคาจาก Order ซื้อขายจริงที่เกิดขึ้นในตลาด ดู Bid (ผู้ซื้อ) และ Ask (ผู้ขาย) แต่ละราคา เพื่อเห็นว่า Buyer หรือ Seller กำลังครอง Footprint Chart แสดง Volume ที่แต่ละราคา Volume Profile แสดง Volume สะสมแต่ละ Price Level Delta = Buy Volume – Sell Volume Order Flow Read Volume Footprint Chart Forex Order Flow เป็นการวิเคราะห์ขั้นสูงที่ดู “เบื้องหลัง” ของแท่งเทียน ปกติเราเห็นแค่ OHLC → Order Flow เห็น Volume ที่แต่ละราคา → เห็นว่า Buyer/Seller ใครแข็งกว่า ใช้ใน Futures Market ชัดเจนที่สุด (Volume จริง) Forex Spot Volume เป็น Tick Volume (ไม่ใช่ Volume จริง)
3 เครื่องมือ Order Flow
| เครื่องมือ | แสดง | ใช้ |
|---|---|---|
| Footprint Chart | Bid/Ask Volume ทุกราคาในแท่งเทียน | ดู Buyer/Seller ที่แต่ละราคา |
| Volume Profile | Volume สะสมที่แต่ละ Price Level | หา High Volume Node (HVN) + POC |
| Delta | Buy Volume – Sell Volume | Positive = Buyer ครอง / Negative = Seller ครอง |
Footprint Chart
- คือ: แท่งเทียนที่แสดง Bid Volume (ซ้าย) และ Ask Volume (ขวา) ทุกราคา
- Bid: Volume ที่ Hit Bid (Sell Market Order) → Seller Aggressive
- Ask: Volume ที่ Hit Ask (Buy Market Order) → Buyer Aggressive
- Imbalance: Ask >> Bid ที่ราคาใดราคาหนึ่ง = Buyer Aggressive → อาจขึ้น
- ใช้: หา Imbalance ที่ Key Level → Confirm Entry
Volume Profile
- คือ: Histogram ด้านข้าง Chart แสดง Volume สะสมที่แต่ละ Price Level
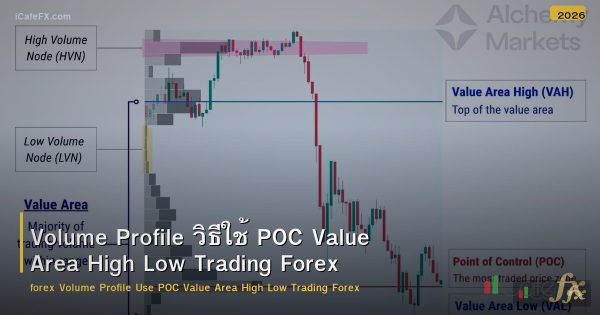
- POC (Point of Control): ราคาที่มี Volume สูงสุด → Fair Value → S/R แข็ง
- HVN (High Volume Node): ราคาที่ Volume สูง → S/R Zone → ราคามัก Consolidate
- LVN (Low Volume Node): ราคาที่ Volume ต่ำ → ราคาผ่านเร็ว → ไม่ใช่ S/R
- Value Area (VA): ช่วงราคาที่มี 70% ของ Volume → “Fair Price Zone”
Delta
- Positive Delta: Buy Volume > Sell Volume → Buyer ครอง → Bullish
- Negative Delta: Sell Volume > Buy Volume → Seller ครอง → Bearish
- Delta Divergence: ราคาขึ้น + Negative Delta → Seller กำลังเข้า → อาจกลับลง
- ใช้: Delta Confirm Candle Direction → Bullish Candle + Positive Delta = Strong
กลยุทธ์ Order Flow
กลยุทธ์ที่ 1: Volume Profile POC + Key Level
- D1: หา POC ของ Weekly/Daily Volume Profile
- Setup: POC ตรงกับ D1 Key Support = Confluence สูง
- Entry: ราคาลงมาถึง POC + Key Support + Bullish Candle → Buy
- SL: ใต้ POC + Buffer / TP HVN ถัดไป
กลยุทธ์ที่ 2: Footprint Imbalance
- Key Level: ราคาถึง Key Support
- Footprint: Ask >> Bid (Buyer Aggressive Imbalance) ที่ Key Support
- Entry: Imbalance + Bullish Candle → Buy
- ข้อดี: เห็น Buyer เข้าจริง → Confirm แข็งกว่า Candle อย่างเดียว
เครื่องมือที่ใช้
- ATAS: Footprint + Volume Profile ครบ (Paid)
- Sierra Chart: Professional Order Flow (Paid)
- TradingView: Volume Profile มี (Footprint ไม่มี)
- Bookmap: Heatmap Order Book (Paid)
ข้อจำกัด
- Forex Tick Volume: Forex Spot ไม่มี Volume จริง → ใช้ Tick Volume → ไม่แม่นเท่า Futures
- ซับซ้อน: เรียนรู้นาน → เริ่มจาก Volume Profile ก่อน → แล้ว Footprint
- Paid Tools: เครื่องมือดี = เสียเงิน → TradingView มี Volume Profile ฟรี
- ไม่จำเป็น: Price Action + Key Level ก็เทรดได้ดี → Order Flow เป็น Edge เพิ่ม
สรุป Order Flow สำหรับ Forex
Order Flow วิเคราะห์ Order ซื้อขายจริง Footprint Bid Ask Volume Profile POC HVN LVN Value Area Delta Buy-Sell Volume Imbalance Buyer Seller Aggressive POC Key Level Confluence Delta Divergence ATAS Sierra Chart TradingView Forex Tick Volume ไม่แม่นเท่า Futures ซับซ้อนเรียนนาน Price Action ก็เพียงพอ ติดตามสัญญาณเทรดได้ที่ xmsignal.com และอ่านบทความเพิ่มเติมที่ siamlancard.com และ siam2r.com


 TH ▼
TH ▼
 English
 Tiếng Việt
 Indonesia
 Melayu
 ខ្មែរ
ខ្មែរ ລາວ
ລາວ 日本語
日本語 한국어
한국어 简体中文
简体中文